Circular Asset Management – Minimization of the release of waste during industrial cleaning
HZ University of Applied Sciences – Asset Management Research
Padraig Naughton and Albert Repko, July 2023
Reading guide – overview of articles
- Overview & general introduction
- Article 1 – Theoretical Framework for Circularity in Asset Management
- Article 2 – Minization of the release of waste during industrial cleaning: Methodology to assess environmental impact – Current Article
- Article 3 – Recommendations on the application of circularity models in Asset Maintenance in the Process Industry
Context
At present, a multitude of techniques are used in the process industry for cleaning industrial equipment, machines, tools, etc. The performance of these methodologies is still insufficiently controlled and assessed in terms of sustainability. Although it is known that cleaning produces a relatively large amount of waste and requires a significant amount of energy, there is insufficient insight into which of the current cleaning methods and processes is the most sustainable one.
Relevance
This is because steering towards sustainability objectives is still relatively new and needs to be developed. There is a need for a methodology to minimize the release of waste during industrial cleaning. And since this is still relatively new ground, it must be built up step by step from the bottom up. This research is a first step in this regard.
Problem
A solid assessment model of industrial cleaning on the basis of the sustainability criterion is not yet available.
Goal and objectives
The overall goal is to minimize the release of waste during industrial cleaning in the process industry. To limit the work and make the research concrete and applied, but still illustrate the approach, the scope is narrowed down to the case of reducing the waste during the cleaning of shell-tube heat exchangers.
The objectives of the present study are:
- the set-up of a decision-model with which a clear objective assessment can be made between the cleaning methods and processes that are currently used in the process industry on the basis of the sustainability criterion;
- the development of a measurement model with which the environmental impact of this maintenance measure can be determined;
- the actual application (and validation) of these models for the heat tube exchanger cleaning.
Note:
As described in the previous Theoretical Framework as outlined in article 1 to fully achieve the above goal additional works will be needed, for instance corresponding sustainability performance requirements still need to be defined in order to be able to assess the performance of the cleaning works. This is further discussed in the recommendations.
Research questions (of this case study):
As mentioned, this research is multi-part, therefore two research questions:
- What does the decision model look like for effectively selecting the best cleaning method and process of the heat tube exchanger, based on the applicable sustainability criteria and operational aspects of the cleaning works?
- How should the environmental footprint of the cleaning activities be determined, and what does its quantification look like in concrete terms?
Summary of the Approach:
The approach has been divided into three main steps based on the previous objectives:
Table 1 – Flow chart research works of wp 5.1
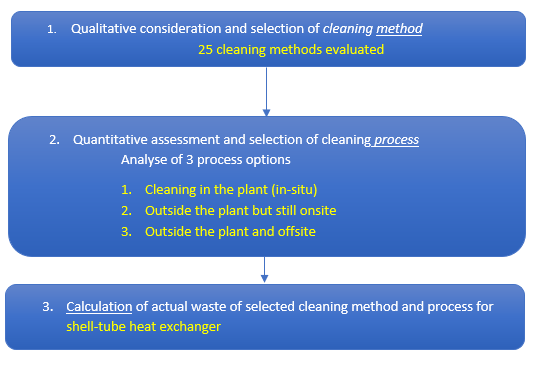
As illustrated, step 2 is based on the cleaning method chosen from step 1. Where step 1 only focusses on the cleaning method itself, step 2 zooms out and determines the environmental impact of the total cleaning process. In this consideration a trade-off is made between cleaning in the plant (in-situ), outside the plant but still onsite or offsite (= on external location outside site).
Method
What are the research steps more in detail? How is the best cleaning method determined for the heat exchanger in detail?
- Qualitative consideration and selection of cleaning method
Given the content of the cleaning process, the sustainability aspect has been considered by looking at water usage, energy consumption, and chemical usage. Similar to the risk priority number (RPN) as used in FMECA applications, an equivalent ‘”RPN number” is defined with which the environmental impact of the previous three factors has been taken into account. It is simply defined as:
RPN = Water usage (1-10) × Energy usage (1-10) × Chemical usage (1-10)
The rating 1-10 (ranging from negligible “1”, to extremely high “10”) is determined qualitatively. Based on this RPN score, the cleaning methods are ordered, with the one with lowest RPN obviously being the most environmental friendly. Furthermore in addition a qualitative assessment has been made to what degree the water that is being used for cleaning is being recycled (0-100%) and to what degree the residue can be re-used (0-100%). Obviously the latter should be included in the former RPN scores to get a fair comparison.
2. Quantitative assessment and selection of cleaning process
As said to be complete, all parts/ aspects of the cleaning procedure should be considered.
The process can be visualized in a flow chart as show in figure 1.
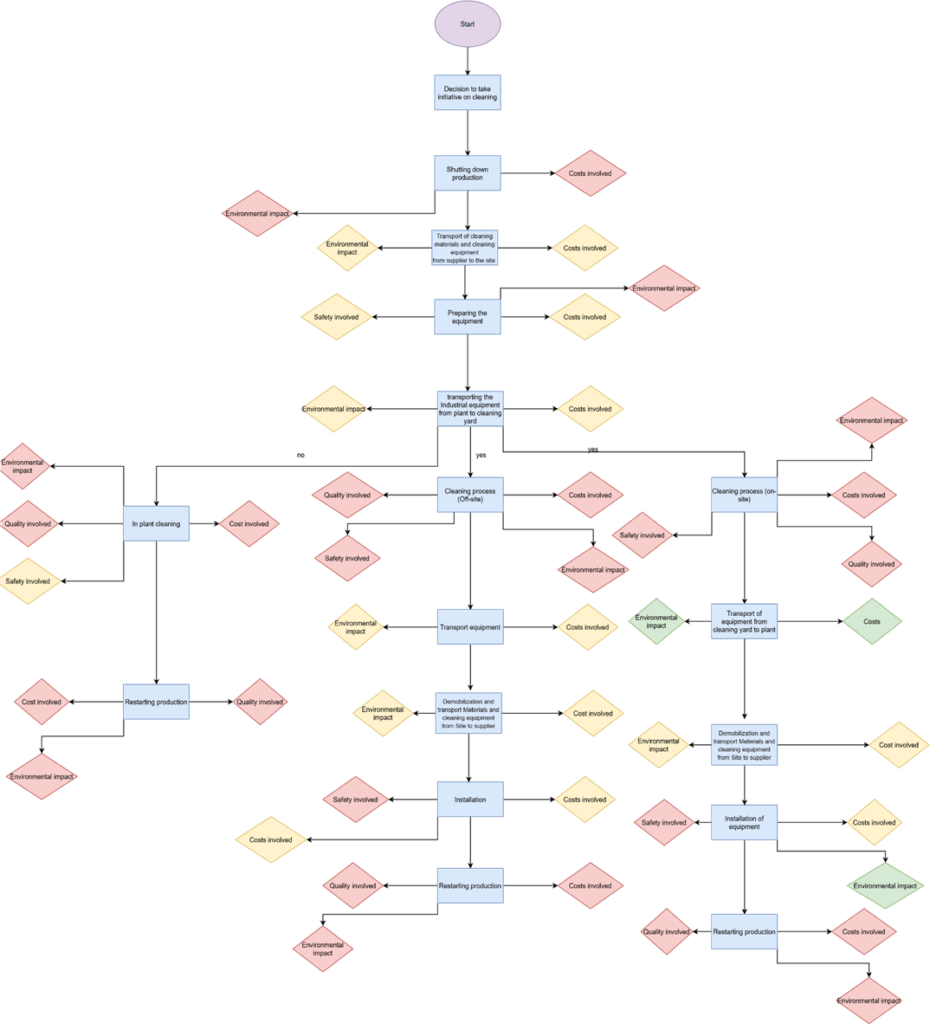
Fig. 1 Process decomposition: Flow chart of total process of 3 alternative methods of industrial cleaning, in-plant, on site, and off site.
Besides environmental impact, the total cleaning process can of couse also be assessed by looking in addition to all relevant RAMSHEEP (key) performance indicators, or more stripped down to essentials like safety, costs, and quality as shown in the above figure. However, as this present report primarly focusses on sustainaiblity, the latter will not be discussed in detail here.
The choice between an in plant, on site or off site cleaning process is determined by the asset owner together with the cleaning company, looking at feasibility, costs, time and relative complexity of the cleaning process versus the operation of the asset.
3. Calculation of actual waste of selected cleaning method and process for shell-tube heat exchanger
Quantification of environmental impact:
The following parameters will be considered during quantification:
- Energy usage: estimates are made of the energy used at each step of the work process. Based on the energy use, a CO2 equivalent can be calculated. This may be electrical energy, diesel fuel etc.
- Water usage: For most of the mechanical methods in use in cleaning shell-tube heat exchangers, water is a very frequently used, in the form of high-pressure cleaning. Water usage is a significant element in the environmental impact factor. The water used can be collected, but is normally polluted and treatment is needed to recover clean water. leading to a higher carbon footprint.
- Chemical usage: Chemical cleaning method are some of the most effective cleaning methods that are in place in the cleaning industry. However, if the chemical cleaning residue is not handled properly, or the chemical cleaning itself is not handled properly, then the environment impact could be high. For this reason, chemical cleaning is a strong element when it comes to quantifying the environmental impact and circularity factor. On the other hand chemical cleaning can be very efficient and effective, resulting in a lower overall environmental effect.
- Fuel: This is considered under energy usage, but it is worth mentioning that apart from the fact that some cleaning methods require fuel for them to function, some of the other parts of the total process require fuel, such as transport. The burning of fuel, depending on which fuel, could cause various concerns for the environmental impact and pollution by leading to the release of gases such as carbon monoxide, carbon dioxide and nitrogen oxides. It is an essential part when providing the cleaning service and needs to be carefully considered when quantifying the environmental impact and circularity factor.
- Recycling waste water: Water usage is in itself an important aspect, as mentioned above. However, special attention should be paid to treatment and recycling of the water. Reuse of the water will contribute to circularity, but the process of recycling is also a result of the cleaning action and needs to be included in assessments. This is a strong element for the circularity part of the total factor.
- Residue disposal: Once the recycling process has taken place the residue must be taken care of properly. Since 99% of the residue cannot be put to use, the residue is then disposed of. the effects of disposal are, for instance incineration, also need to be considered.
- Incineration As mentioned before the final product of the cleaning process is a final residue. However, re-using the residue is not always an option at times which would lead us to destroying the final waste which could be done through burning it. This of course affects the environmental impact factor due to the fuel levels used and potential emissions.
Results
- What are the results, what is the preferred cleaning method and why?
- Qualitative consideration and selection of cleaning method
An extensive study of a total of 25 cleaning methods has been carried out, see figure below.
This has been done for a wide range of equipment, besides heat exchangers, including the cleaning of tanks/ vessels, boilers/ furnaces, piping, cooling towers and others. The total matrix covering all this equipment is enclosed in appendix I. The figure below only shows the decision matrix regarding the cleaning of the shell and tube heat exchanger; to limit the scope of the works this is the only equipment whose cleaning has been further studied in the following quantitative assessment of the cleaning process in step 2.
Table 2 Qualitative assessment and selection of cleaning method
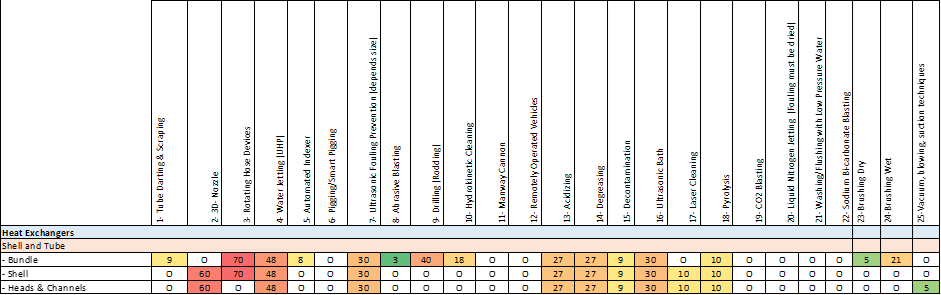
The numbers in the figure are the RPN numbers of the cleaning method, obviously the ones with smallest value are the preferable methods from a sustainability perspective. For instance Abrasive Blasting scores best and is therefore preferred. The final decision on the choice of method is, however, dependent on many other factors. So the experts will need to weigh up what is possible. This assessment gives input to allow the environmental aspects to be included in the decision.
Additional background information:
- Qualitative assessment and selection of total cleaning process
Qualitative assessment of location as input for selection of in plant (=in situ), on site or off site based cleaning process:
Table 3 Qualitative assessment of location as input for selection of cleaning process
| Criteria | In-situ | On-site | Off-site | Weight | Total In-situ | Total On-site | Total Off-site |
| Frequency of current usage | 5 | 5 | 1 | 5 | 25 | 25 | 20 |
| Cleaning method possibility | 3 | 5 | 5 | 3 | 9 | 15 | 15 |
| Complexity of process | 2 | 5 | 5 | 5 | 10 | 25 | 25 |
| Total | 44 | 65 | 60 |
Motivation of scorings:
- Frequency of current usage: In-situ and on-situ cleaning is both applied in 40% of cases in practice (5pts), off site only 20% (1 pt)
- Cleaning method possibility: applicability of in-situ cleaning is limited compared to other two (3 pts vs 5 pts);
- Complexity of process: in-situ cleaning involves a rather complicated process compared to the other two (2 pts vs 5 pts).
Based on this comparison the on-site process option appears to be marginally favorable in terms of applicability. The final decision is normally based on the asset owner and cleaning company experience, keep in mind all factors surrounding the asset.
- Calculation of actual waste of selected cleaning method and process for heat tube exchanger
In summary:
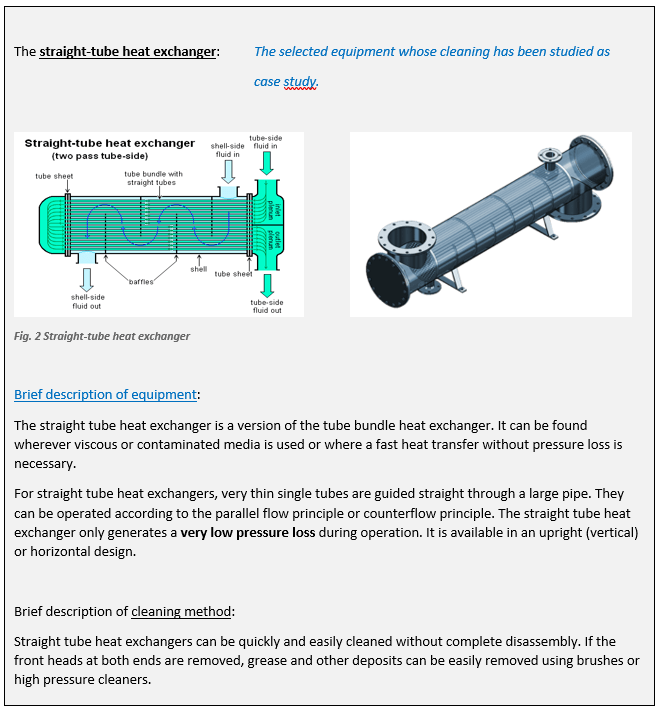
- Equipment that is cleaned: straight-tube heat exchanger
- Selected cleaning method: Water Jetting (UHP) – this is most commonly used for this application
- Selected cleaning Process: On-site
The process steps with the quantified used water (re-used, recycled is negative), nitrogen gas, C02 emission in kgs/ footprint:
Table 4 Calculation of actual waste of selected cleaning method and process for shell-tube heat
exchanger
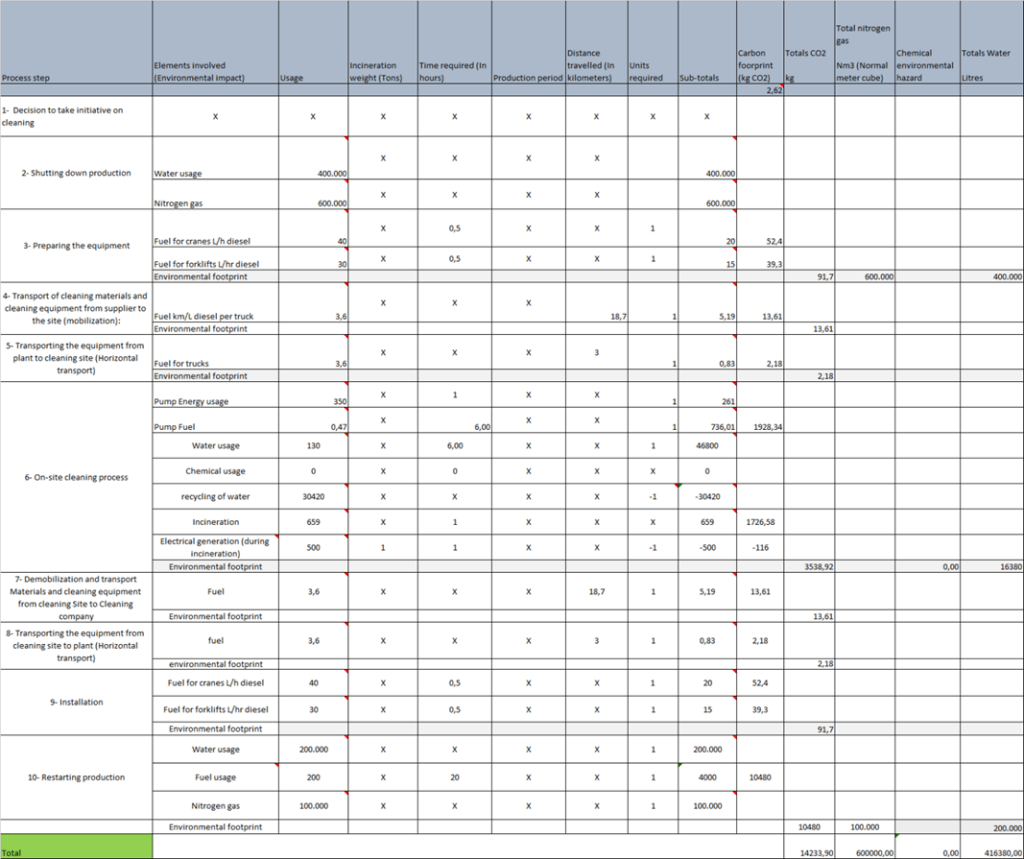
The aim of the research is multi-layered. First of all, developing a decision model with which a clear objective assessment can be made between the cleaning methods/ processes that are currently used in the process industry for heat exchangers on the basis of the sustainability criterion. Secondly, the development of a measurement model with which the environmental impact of this maintenance measure can be determined. This concerns the quantification of C02 emissions, Nitrogen gas consumption, and total water consumption. As a case, the footprint of the most commonly used variant is worked out/ calculated.
The decision and measurement model has been developed on the basis of the indicated three-step plan. The application in the case study indicates the best cleaning methods with respect to shell-tube heat exchangers. The most commonly used cleaning process for bundles has been evaluated, based on on-site cleaning. Furthermore the corresponding KPIs CO2 emissions, Nitrogen gas consumption, and total water consumption of the cleaning have been quantified.
Discussion and recommendations
This applied bottom-up research is actually an exploratory study into how the process industry can sustainably regulate and control maintenance in general and the cleaning of equipment in particular. The step-by-step plan and the methodology set out should therefore be regarded as a first step towards a more refined and further developed methodology. Below are a further analysis and recommendations with regard to the step-by-step plan of the research itself, including recommendations related to the development of tools to be able to zoom out from operational to tactical and strategic level (and vice versa) and as such to obtain a clear line of sight how to manage the maintenance works effectively from a sustainability perspective (as also outlined in chapter 2).
Step 1 Selection of cleaning method:
- In the analysis, equal weight was assigned to the 3 parameters (water usage, energy usage, chemical usage). The question is whether this matches the relative criticality of each, or otherwise stated: What does the company find acceptable in terms of consumption, is prioritization needed (link with company value matrix)?
- The heat exchangers has been split up in 3 parts (bundle, shell, heads and channels): how large is the relative contribution of each? Again, should weighting factors be used to refine this, is it reasonable to assume that all three contribute equally?
- Selection is still done qualitatively and then various methods quantified, is earlier quantified selection possible in future ?
Step 2 Selection of cleaning location:
- Frequency of current usage is used as selection parameter. Although this provides insight which process is preferred in the daily practice of the process industry, most ideal this should be further translated into more concrete decision parameters, arguably best when related to the sustainability KPIs of the cleaning process;
- Selection is still done qualitatively, is a quantified selection possible in future? Evaluation of a large number of options and variants would enable direct comparisons on a quantitative basis.
Step 3 Quantification of water usage, nitrogen gas and CO2 emission
- Absolute quantities have been determined, but what else does this mean? There is still no frame of reference with regard to it. In other words, performance requirements and targets with regard to sustainability must be determined. For this tools like the circularity ladder, the CO2 performance ladder can be used. As illustrated and discussed in the previous theoretical frame work, in this way the constantly ongoing circular “sustainable maintenance” process of Plan-Do-Check-Act is closed, see figures below:

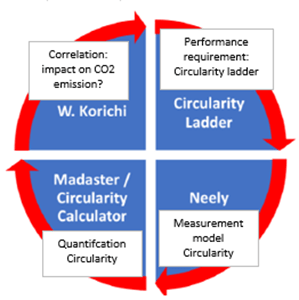
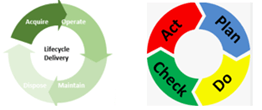
Fig. 4 Circular process performing “sustainable maintenance”, based on KPIs CO2 performance and Circularity the middle figure takes also into account a possible correlation between circularity and CO2 emission. On the right side in addition the continuous character of these repeating processes is illustrated with the lifecycle delivery and the Plan-Do-Check-Act circles)
The present study has mainly focused on waste: besides CO2 emission, also water usage, emission of nitrogen gas. When talking about circularity, water usage might be a useful KPI in case that the water is (partly) reused. How to translate all these parameters into a limited number of corresponding core values can be further studied;
In addition, also necessary for a failure analysis: does the system comply now, or are measures needed to reduce the emissions? And suppose that the corresponding performance requirements have been defined and that the current emissions exceed these bench mark values, how critical is that? In other words: what are the corresponding risk acceptance levels of the sustainability core values to be defined in the company value matrix?
– When making a more in-depth comparison of maintenance measures based on KPIs such as CO2 emissions: see fig. 11 in theoretical framework of article 1. For a fair comparison and in order to obtain a total overview, similar to LCC analysis of costs, for instance the CO2 emissions over time can be evaluated. As also emphasized in the latter article, it is important to be complete, so not only look at the CO2 emission of the maintenance measure itself over time, but also the CO2 emissions of the total installation (of which the shell-tube heat exchanger, in this case, is part of). The latter also means developing models that estimate “CO2 condition” of the total installation over time, in accordance with the commonly used P-f curves for the determination of the minimal inspection interval of maintenance works (of an aging ((sub) component of) an asset).
To the next article
Article 3 – Recommendations on the application of circularity models in Asset Maintenance in the Process Industry – COMING SOON
References (all articles)
- Roes, Van der Male (2019) Eindrapport Project Circulaire Verdienmodellen in de procesindustrie en maintenance sector. KicMPi
- M. Nagelhout, R. Schoenmaker (2020), Measurement Model Circular Maintenance, Research Group HZ Asset Management.
- IAM (Institute of Asset Management) (2015). Asset Management – An antonomy Version 3. Bristol.
- IAM, Robert Davis (no date), an Introduction to Asset Management. EA Technology Ltd
- Smith, Thomas W (2014). The impact of ISO 55000. The New Asset Management Handbook. Reliability Web
- Schoenmaker (2011). De ingeslagen weg. Delft: Next Generation Infrastructures Foundation.
- www.plant-maintenance.com [accessed: 16-02-2021]
- PBL Netherlands Environmental Assessment Agency. Circular Economy: Measuring Innovation in the Product Chain. 2017. Available from: https:// www.pbl.nl/en/publications/circulareconomy-measuring-innovation-inproduct-chains [Accessed: 2021-04-02]
- A. Neely, H. R. (1997). Designing performance measures: a structured approach. Cambridge: University of Cambridge.
- Rau-Oberhuber, F. H. (2019, September 26). Calculation, and evaluation of circularity indicators for the built environment using the case studies of UMAR, and Madaster. Retrieved from sciencedirect.com: https://www.sciencedirect.com/science/article/pii/S0959652619333529
- (n.d.). Retrieved from circularitycalculator.com: http://www.circularitycalculator.com/#us
- W. Korichi (2021), Decision model for industrial cleaning. HZ
- https://www.kizeo-forms.com/en/ – Mobile Forms Application