Theoretical Framework for Circularity in Asset Management
HZ University of Applied Sciences – Asset Management Research
Padraig Naughton and Albert Repko, July 2023
Abstract
In the context of the Interreg project Circular Maintenance, the research groups Asset Management (AM) and Data Science (DS) of the HZ University of Applied Sciences (HZ UAS) have conducted research, in close cooperation with the project partners, into the development of instruments for the effective and efficient implementation of circular maintenance within the process industry. Several products have been delivered. From a theoretical perspective a top-down framework with tools, with a clear line of sight from strategic, tactical to operational level. These principles are known in the Asset Management field, but focus here was on a clear translation into managing sustainability objectives. Measurement models have been drawn up to help quantify the Circularity and CO2 emissions of maintenance processes. The theory has been tested in practice in a case study. In that case study minimization of the release of waste and emissions during industrial cleaning was considered. The problem at the start of the research was that a solid assessment model of industrial cleaning on the basis of the sustainability criteria was not yet available. To limit the work and make the research concrete and applied, but still illustrate the approach, the scope is narrowed to the case of reducing the waste and emissions during the cleaning of shell-tube heat exchangers. The research is set out in three articles. In this first article mainly theory is discussed, followed by two articles addressing the translation of the theory into practice and the resulting conclusions and recommendations.
Reading guide – overview of articles
- Overview & general introduction
- Article 1 – Theoretical Framework for Circularity in Asset Management – Current article
- Article 2 – Minization of the release of waste during industrial cleaning: Methodology to assess environmental impact
- Article 3 – Recommendations on the application of circularity models in Asset Maintenance in the Process Industry
Content of this article
- Context
- Theoretical Framework
- Setting up a theoretical framework for circular asset management
- Circularity ladder
- Company value matrix with core values related to circularity
- Six-stage model: model of maintenance process including sustainability as input
- Maintenance measures and the link with circularity
- Time related failure patterns, p-f curves, inspection intervals, sustainability
- Setting up theoretical measurement and the process model for the case study
- KPI circularity and KPI CO2 emissions
- Steps towards an Environmental Performance Ladder (EPL)
- Setting up a theoretical framework for circular asset management
- Research Method
- References (all articles)
1. Context
In the last few decades there has been extensive discussion about the circular economy and the need for improvements with respect to sustainability. While intentions are good, economies are slow to change, resulting in delays in turning ideas and theories into action. In this work we have taken some steps to link the theories to pragmatic approaches with a particular focus on circular maintenance in the process industry.
To successfully implement change, it is necessary to explore the fundamental and choose the most effective approach. This article further develops various models and theories, many of which are already in the public domain. The goal is to translate these theories into a pragmatic approach which is intuitive for professionals who are familiar with traditional business and asset management practice. It is hoped that this will enable organizations to embed circularity in their values and practice, in the same way that financial, safety and market objectives are treated.
2. Theoretical Framework
Setting up a theoretical framework for circular asset management
It is important to first establish a conceptual framework model for carrying out circular asset management. We deliberately refer to circular asset management (AM) and not just circular maintenance. The term asset management is thought to be more appropriate here as asset management encompasses much more than maintenance alone. It addresses the entire organization and process from strategic, tactical to operational level. The approach is to first consider circularity from a broad perspective in order to cover the total scope of the circular economy and then zoom in on the practical application of the theory on an operational level in the case studies which in turn focus more on circular maintenance. Having a total overview is key when considering the sustainability aspects of industrial processes and equipment. AM in a broad context and its total scope is summarized in the Institute of Asset Management (IAM) Conceptual Model:

Circularity ladder
The degree of circularity for an asset is already represented by the life cycle delivery aspect of effective asset management. From the perspective of circularity, the aim is to make this process as circular and continuous as possible through the pursuit of the ‘R-strategy’, expressed in literature varying from 3Rs up to 14Rs. The circular economy butterfly from the Ellen Macarthur foundation also encompasses similar thinking. See Figure 2 below.
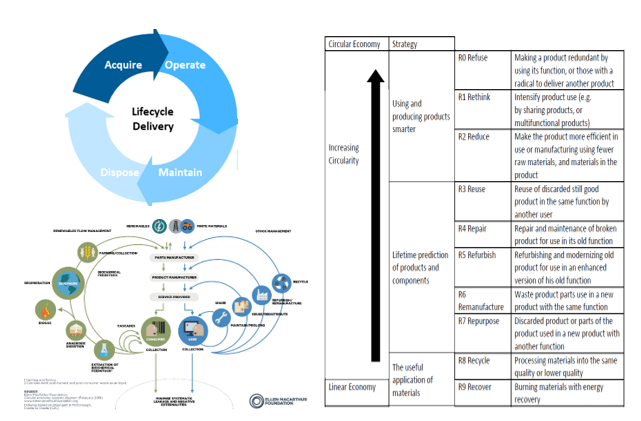
“R-Strategy model” for the circular economy describe a range of levels from a fully linear economy (without any form of circularity) and gradually progressing to the optimal, ideal situation of 100% circularity. This so called circularity ladder (table) is a useful tool for organizations to determine their circularity strategy.
Company value matrix with core values related to circularity
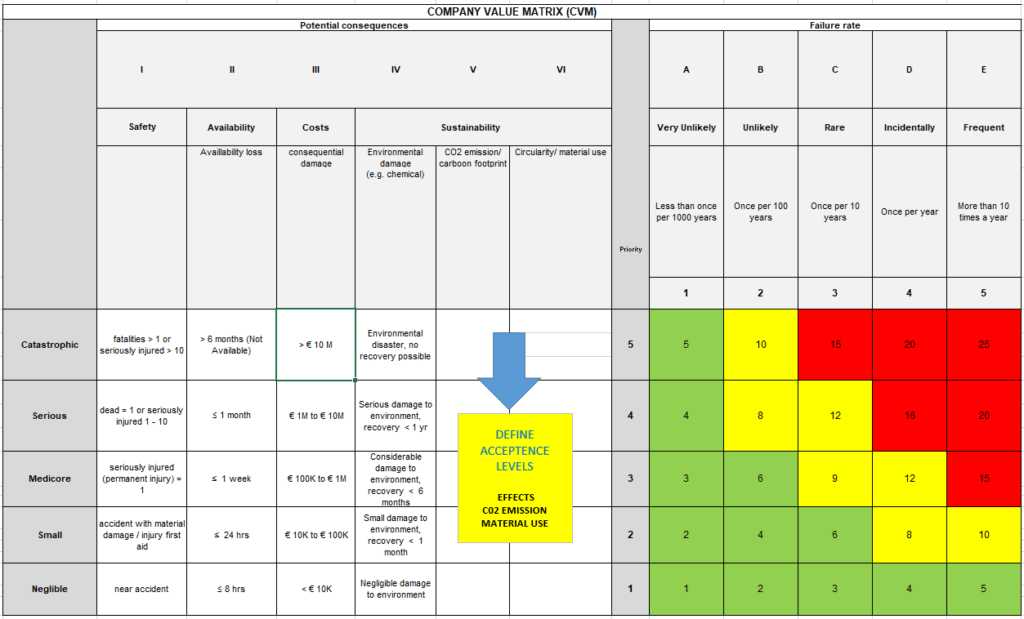
Our work considers a risk-based approach to asset management. The non-functioning or failure of an asset is assessed on the basis of performance requirements which are derived from the AM objectives. The risk aspect related to delivery on the requirements for the asset are determined by the probability of failure and the associated effects/ consequences. To determine the relative criticality of risks a so called company value matrix (CVM) is used. In this matrix a direct link is made between the consequences of failure and its influence on the core values of the organization; in the matrix, the acceptance limits of these consequences are established per core value. Table 1 shows an example of a possible CVM. To ensure that sustainability aspects are also taken into account when weighing risks, it is logical to define core values that are clearly related to this. In the example, the core values of environmental damage, C02 emission/carbon footprint, and circularity/ material efficiency have been used.
Six-stage model: model of maintenance process including sustainability as input
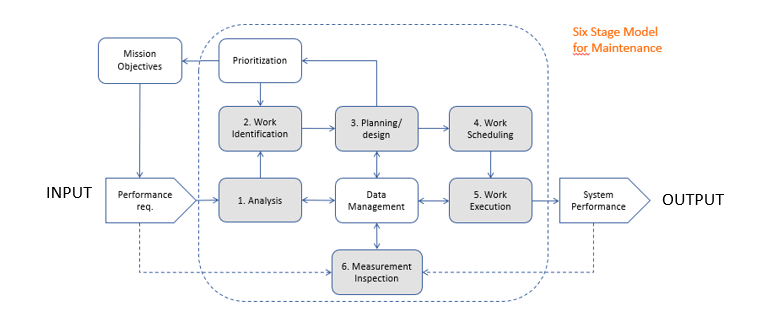
We use the six stage model, shown in Figure 3, to provide a structured overview of the maintenance work process. It is generally applicable for the maintenance of assets and/or processes. The six stages, indicated in grey, are the six main steps of the continuously ongoing cyclical maintenance process. Furthermore, this model shows the line of sight from strategy (mission/ vision/ core values/ goals) via tactical (performance requirements as input/prioritization) to operational (the maintenance cycle); and the fact that (effective) data management is central to the entire process.
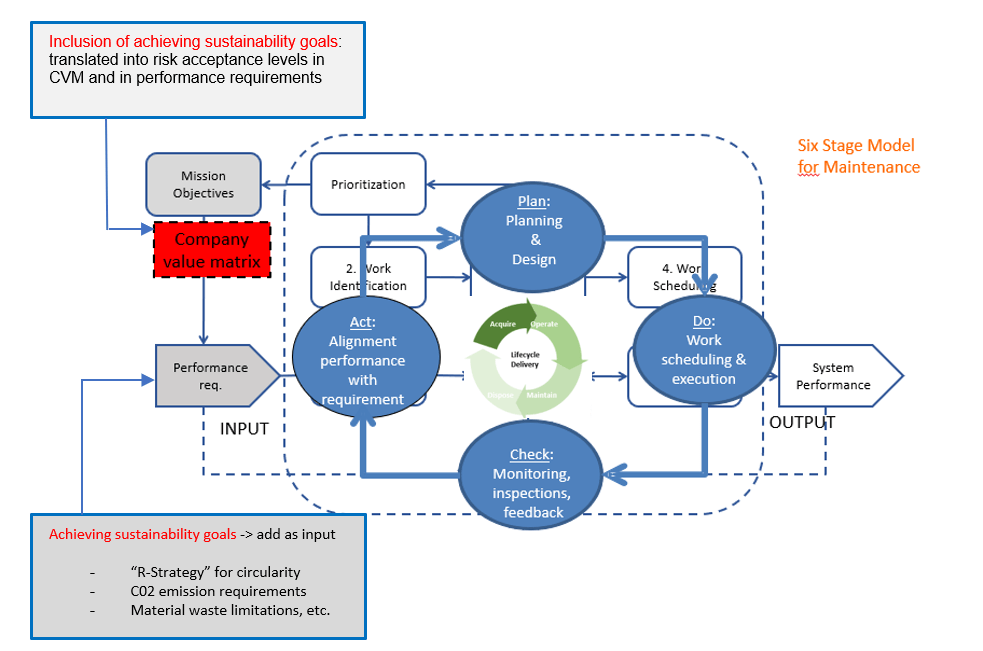
The left side of the diagram shows the input of the process. As shown more extensively in Figure 4, the input drives the performance requirements with which to assess the performance of the asset, object, installation, or process. The CVM is the reference to assess the criticality of the risks. Both are derived from the company’s strategy, mission and objectives. Thus, management based on sustainability objectives can be achieved by incorporating sustainability core values in the CVM and imposing matching performance requirements related to circularity. Furthermore, in the circular process also the well-known Plan-Do-Check-Act (PDCA) cycles can be recognized. This maintenance process is in principle a continuous ongoing cycle. The preceding design and building phases of the life of an asset are critical to enable efficient and effective management of sustainability during the operation and maintenance phases (O&M) and should also include the input from the CVM and performance requirements to achieve a totally integrated asset management strategy.
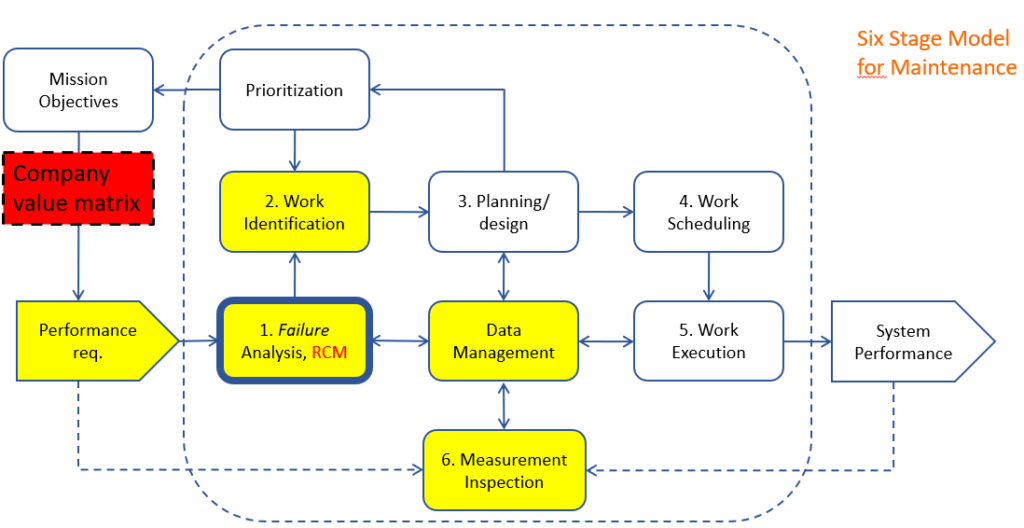
In the maintenance process, step 1 concerns an analysis of the current condition of an asset, installation or process. Of course this just represents the situation at a certain moment in time; during the entire O&M phase, the cyclical maintenance process is continuously executed and the analysis is constantly updated on the basis of the latest state of affairs.
Based on a risk (and data-driven) approach, the analysis concerns a failure risk analysis. Various risk analysis methods can be used. Reliability Centered Maintenance (RCM) is a well-known and often used approach, which includes the use of a Failure Modes -Criticality- and Effects Analysis (FME-C-A). In Figure 5, the steps that are part of this analysis are indicated in yellow. The CVM is also used here to determine the criticality of the risks and to be able to prioritize based on the mission/ objectives of the organization.
Maintenance measures and the link with circularity
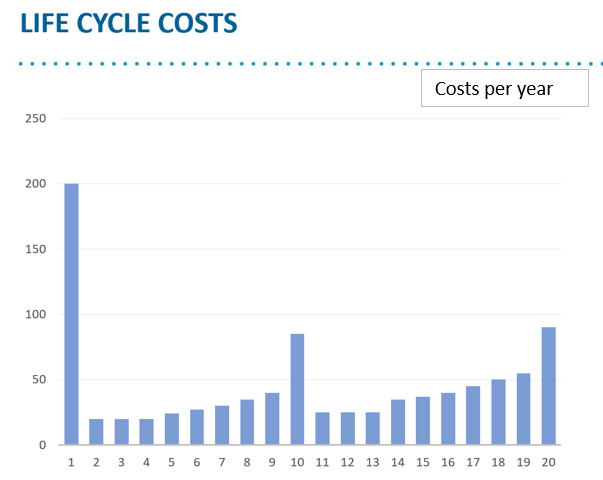
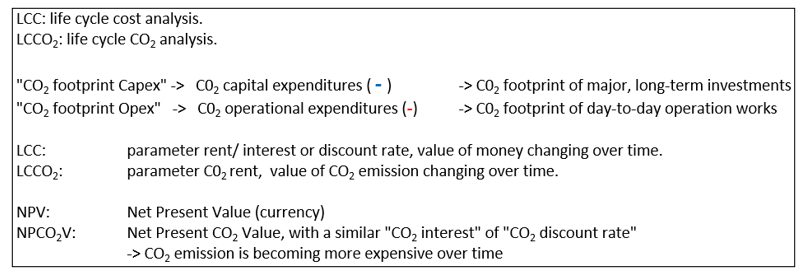
In current practice, measures are still mainly weighed against each other on the basis of costs. To this end, a Life Cycle Costing (LCC) analysis is performed for each maintenance measure, in order to obtain a good overview of the associated (CAPEX and OPEX) costs during the entire life cycle. In order to compare the costs of the measures, the total costs over the design life or a fictitious end date, are often considered. The time value of money, the Net Present Value (NPV), is taken into account in the analysis, see Figure 6 as an illustrative example.
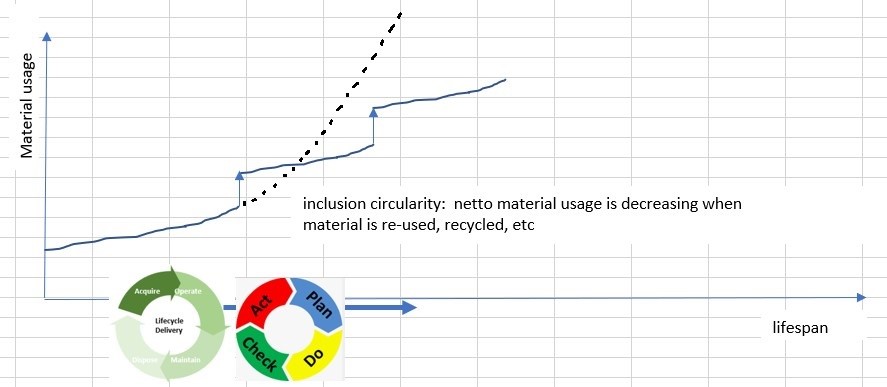
The same long-term analysis can also be performed when looking at material efficiency and emissions. Some striking parallels can be drawn here with the above-mentioned LCC analysis. Consider the material usage related to an asset over time, as sketched in Figure 7. The step-wise increases in material usage represent the material consumption related to conducting maintenance measures. These could be considered as being equivalent to “Material CAPEX expenses” or refurbishments when making the comparison with the similar CAPEX cost expense of a maintenance measure in an LCC analysis. The gradual ascending curves show the material consumption on a more daily/ operational basis, such as that of frequent inspections, but in a full analysis also include the overall material waste of the installation being maintained. Depending on the process and installation, the frequency of maintenance can influence the total material waste throughout the life of the asset. In many cases, more frequent maintenance will lead to a step-wise increase in material loss, but to overall benefits over the life of the asset. Finally the degree of circularity contributes directly in the sense that less “new/ net” material is used when the maintenance measures taken are more circular. The step-wise increase is then also reduced.
| LC”Mat.”: | → Life cycle material use | |
| Material Capex” | → Material capital expenditures | → Material use of major, long-term investments |
| “Material Opex” | → Material operational expenditures | → Day-to-day material waste |
| NP”MAT”V: | → Net Present Material Value, with a similar “Material interest” | → value of Material increasing with time |
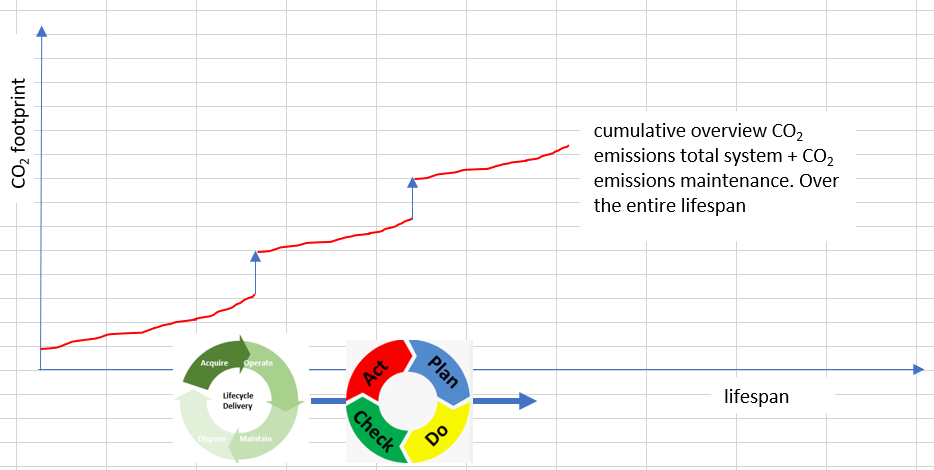
The same approach can be followed when looking at the long-term CO2 emissions per maintenance measure, see Figure 8.
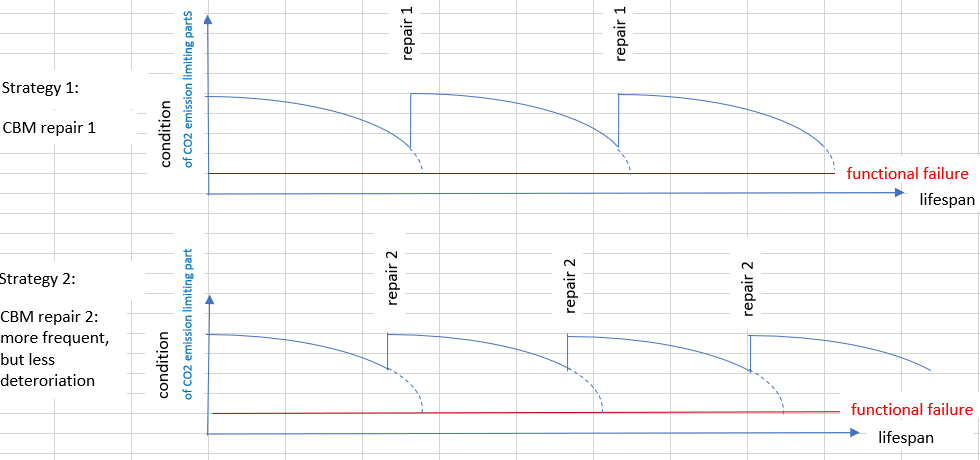
Time related failure patterns, p-f curves, inspection intervals, sustainability
The P-F curve is a widely used tool to visualize the technical aging of an asset over time and to determine the required inspection interval. Application of similar diagrams for gaining insight and control of, for example, CO2 emissions and material consumption are also quite conceivable. The definition of “condition” must then be related, for example, to the relative CO2 emissions or material waste. As long as the asset or installation performs well and consistently, the line is horizontal. If the condition gradually decreases in the sense that the emissions increase, the 2nd curved part of diagram is being followed; “failure” then occurs when the maximum permissible emissions are exceeded. As an example the maintenance of an engine, such an approach could be used to monitor and check the emission of polluted gasses. If the catalyst on the engine’s exhaust system performs poorly and the “condition” of the engine threatens to exceed the maximum permissible standard requirement with regard to exhaust emissions, the catalyst must be replaced early. On the basis of such a P-F curve, it is possible to determine at an early stage which maintenance/ inspection frequency is required to prevent interventions being carried out too late or enable extension of the time between repairs. In addition, these diagrams can also be used to compare maintenance strategies as shown in Figure 9. In principle this is comparable to what has been described previously, only in Figure 8 the CO2 emissions of the total installation has been plotted cumulatively over time.
Setting up theoretical measurement and the process model for the case study
KPIs for circularity and CO2 emissions
Commonly used performance indicators in asset management are often related to the so-called RAMS SHEEP requirements: requirements for reliability, availability, maintainability, safety, security, health, environment, economics, and politics. Sustainability is to varying degrees implicit in all of the RAMSHEEP requirements. However, there is a need to make it more explicit in order to ensure that it used as a driving force in asset management. Measurements and indicators related to sustainability and can be used to make this explicit are, for instance, the previously mentioned circularity ladder and the so called CO2– “Performance Ladder”.
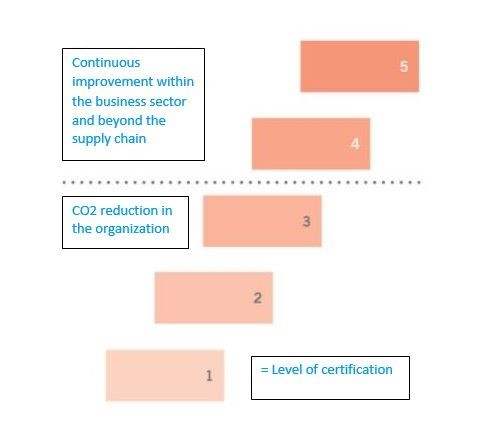
The CO2 Performance Ladder is a CO2 management system that consists of 5 levels (see Figure 10). Up to and including level 3 an organization becomes aware of and starts working with the emissions of its own organization (and all projects). From level 4 and 5, work is also being done on CO2 emissions in the chain and sector. A certified organization meets the requirements of the CO2 Performance Ladder at a certain level (and all underlying levels). The authors suggest that this is compatible and can be integrated into the maturity assessments of organizations with respect to asset management, from the IAM (https://theiam.org/media/4244/iam-the-pathway-to-excellence-in-asset-management-preview.pdf ). The requirements for the CO2 Performance Ladder encompass four perspectives:
A- Insight: Determining the energy flows and the CO2 footprint;
B- Reduction: Developing ambitious CO2 reduction targets;
C- Transparency: Structural communication about CO2 policy;
D- Participation: Participation in initiatives in the sector in the field of CO2 reduction.
Each certified organization is audited annually by an independent and accredited Certification Body (CB). As a result, a certified organization is guaranteed to have a working CO2 management system for the organization and the projects, which is tested annually for ambitions, reduction and continuous improvement. (Reprinted, quoted from SKAO website www.co2-prestatieladder.nl).
The term “environmental footprint” is used when considering waste and pollution in a broader context than just CO2. In addition to the CO2 emission/ carbon footprint this could include:
- Chemical waste;
- (Fresh) water consumption; and other
- Material waste/ inefficiency.
A further extension, and development of an “Environmental Performance Ladder” would then be an obvious further development, which would incorporate emissions, circularity and waste in all its forms.
Steps towards an Environmental Performance Ladder (EPL)
Often the circular continuous maintenance process is simply referred to as the Plan-Do-Check-Act (PDCA) circle. The same circular process can be interpreted when managing on the basis of the aforementioned sustainability KPIs, limiting CO2 emissions and increasing Circularity (of the installation itself and/or its corresponding maintenance process), see the illustrating figures 11 and 12. Similar circular process models can of course also be made for all kind of other possible sustainability KPIs related to the three core principles of the circular economy: eliminate waste and pollution, circular products and materials (at their highest) value, and regenerate nature (ellenmacarthurfoundation.org). Note that in the conceptual circular model of the KPI (Increasing) Circularity also the recheck of the KPI (Reducing) CO2 emission is included. This has been done to indicate the relationship between the two: if measures are taken to increase circularity these may have an influence of the CO2 emission. However, arguably to be complete, in turn a recheck of the KPI Circularity may also need to be added to the conceptual model of the CO2 Performance Ladder from SKAO since the dependency between the two can work in either direction. These dependencies also indicate the relative complexity of effectively managing sustainability goals. A possible pitfall is therefore to focus too much on one single KPI without overseeing the relationship with others, also in line with the advice to not only look at operational/ maintenance level, but to further zoom out and consider sustainability on tactical and strategic levels.
3. Research Method
The team adopted a broad methodology to ensure that the objectives of the project were achieved. This project was with different companies related to maintenance in the process industry.
In short the following sources of information have been used:
Meetings and interviews were the main source of data collection as many different organizations were involved in the project. Additionally, the information required for successful completion was often not found in open literature. Therefore, the most reliable option was to plan regular meetings with different industrial companies, which allowed the collection of data required for market assessment in order to create an optimal solution for a quantifying, systematic approach.
Desk research: As mentioned in the paragraph above, finding in-depth valuable information through desk research for this industry can be difficult due to the confidentiality of the industry. However, that does not imply that we cannot collect information, as we can often find valuable information publicly available, even if this is mostly qualitative information. This meant that this was our second focus when it came to our methodology for data collection.
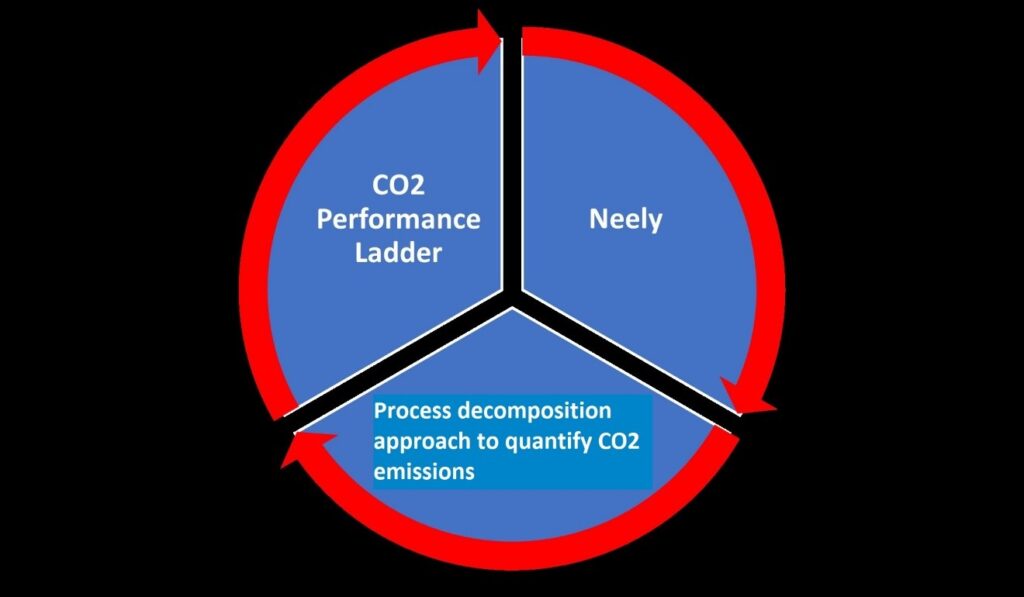
Data analysis: The main focus of the project was to build the quantification system to allow the quantification of different factors such as environmental impact, costs, safety and quality. For this part, we developed the process decomposition approach to quantification. This involved analyses of the different contributing elements of each factor such as the time duration of each step, the distance covered per process step, the rate at which it consumes fuel/energy and wastes materials. The conversion units used are highly important, as the quantification system is coded to directly convert the units as necessary, such as converting diesel fuel consumption to CO2 emissions. The research was built in a structured way in cooperation with students and researchers and extensive input from the project partners. In most cases the research was systematically expanded based on the work of the previous researchers/students throughout the project, to culminate in a body of work which enables conclusions.
The deliverable of the theoretical framework has been an AM framework with tools to effectively apply circular asset management with a clear line of sight from strategic, tactical to operational level. Furthermore theoretical circular process models have been identified or developed to quantify the KPIs Circularity and CO2 emissions. In the remaining part of the research the theory is tested in practice in the context of the process industry. In article 2 of this series, the results of the case study related to industrial cleaning of shell-tube heat exchangers will be presented. In that case study quantification of CO2 and the release of waste during industrial cleaning was considered. At the start of the research a solid assessment model for industrial cleaning on the basis of the sustainability criteria was not yet available. The overall goal was to quantify the CO2 and waste to enable minimisation of emissions and the release of waste during industrial cleaning in the process industry. To limit the work and make the research concrete and applied, but still illustrate the approach, the scope was narrowed to the case of the cleaning of shell-tube heat exchangers.
To the next article
Article 2 of 3: Application of circularity models to Maintenance in the Process Industry
4. References (all articles)
- Roes, Van der Male (2019) Eindrapport Project Circulaire Verdienmodellen in de procesindustrie en maintenance sector. KicMPi
- M. Nagelhout, R. Schoenmaker, Measurement Model Circular Maintenance, HZ University of Applied Sciences, Asset Management Research, 2020
- IAM (Institute of Asset Management) (2015). Asset Management – An antonomy Version 3. Bristol.
- IAM, Robert Davis (no date), an Introduction to Asset Management. EA Technology Ltd
- Smith, Thomas W (2014). The impact of ISO 55000. The New Asset Management Handbook. Reliability Web
- Schoenmaker (2011). De ingeslagen weg. Delft: Next Generation Infrastructures Foundation.
- www.plant-maintenance.com [accessed: 16-02-2021]
- PBL Netherlands Environmental Assessment Agency. Circular Economy: Measuring Innovation in the Product Chain. 2017. Available from: https:// www.pbl.nl/en/publications/circulareconomy-measuring-innovation-inproduct-chains [Accessed: 2021-04-02]
- A. Neely, H. R. (1997). Designing performance measures: a structured approach. University of Cambridge.
- Rau-Oberhuber, F. H. (2019, September 26). Calculation, and evaluation of circularity indicators for the built environment using the case studies of UMAR, and Madaster. Retrieved from sciencedirect.com: https://www.sciencedirect.com/science/article/pii/S0959652619333529
- (n.d.). Retrieved from circularitycalculator.com: http://www.circularitycalculator.com/#us
- Korichi W. , Naughton P. (HZ UAS), Borgt H. (Dow), Dingemans J. (Evonik), Decision model for industrial cleaning, study at HZ University of Applied Sciences, Asset Management Research, 2021.
- van den Broucke J., de Krijger J., Naughton P. (HZ UAS), Schouten L. (Ki<|MPI), Vancauwenberghe W. (BEMAS), study at HZ University of Applied Sciences, Asset Management Research, 2021.
- https://www.kizeo-forms.com/en/ – Mobile Forms Application
- Categorisation System for the Circular Economy, European Commission Directorate-General for Research and Innovation Directorate, RTD-PUBLICATIONS@ec.europa.eu, European Commission, Brussels, Manuscript completed in March 2020
- The Fabulous 14 R’s of Sustainability, by Leslie Crenna, 2017
- https://www.cooldavis.org/2017/04/21/fabulous-14-rs-sustainability/